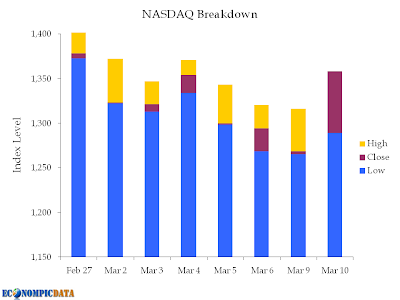
While the NASDAQ returned a whopping 7.1% yesterday (and I hope yesterday is something "we can build on"), I warn all investors not to get too far ahead of themselves. As the title above and chart below details, the closing value of the NASDAQ returned it to a level last seen just 4 days previous.

More, including a scatter plot* of returns after various one day moves.
*Here's a teaching example from UI-Chicago:
Scatter plot matrix: Given a set of variables, the scatter plot matrix contains all the pair-wise scatter plots of the variables on a single page in a matrix format. The example generated by XmdvTool shows a 4x4 scatter plot matrix of the variables medhvalue (median house value), rooms (# of rooms), bedrooms (# of bedrooms), and households (# of households).
Top row in the graph shows 1. the scatter plot of medhvalue and rooms, 2. the scatter plot of medhvalue and bedrooms, and 3. the scatter plot of medhvalue and households. The second row in the graph shows 4. the scatter plot of rooms and bedrooms and 5. the scatter plot of rooms and households. The third row in the graph shows 6. the scatter plot of bedrooms and households.This scatter plot matrix shows that rooms, bedrooms, and households are highly correlated. Note that when there is a high correlation between A and B and between A and C, there is a high correlation between B and C.
